Hey there! Let’s chat about profit margins – Ever wonder how much money a business actually keeps after covering its costs? That’s where profit margin comes in. It’s a simple way to measure how efficiently a company turns revenue into profit. Whether you’re running a small business, investing in stocks, or just curious about how companies stay afloat, understanding profit margins can give you valuable insights.
How is it calculated? What’s the difference between gross, operating, and net profit margins? And most importantly, how can businesses improve them? Let’s break it all down in a way that actually makes sense.
What is Profit Margin?
Think of profit margin as the percentage of each dollar of sales that turns into actual profit. When someone says, “What’s your margin?” they’re asking how much of each sale you get to keep after all expenses.
Profit margin differs from markup in an important way. Markup is the amount added to your cost to determine selling price. Margin is calculated based on your selling price.
Profit Margin Example
- If you buy something for $50 and sell it for $100, your markup is 100% ($50/$50)
- But your margin is 50% ($50/$100)
This confusion between margin vs. markup trips up many business owners.
Types of Profit Margin & How They Work
Let’s break down the three main types of profit margins that business owners and investors look at:
- Gross Profit Margin
- Operating Profit Margin
- Net Profit Margin
Gross Profit Margin: What It Is and Why It Matters
This is the simplest form of profit margin – it only considers the direct costs of producing your product or service.
When a business sells something, it doesn’t keep all the money—it has to cover the cost of making or buying that product. What’s left after those costs is called gross profit, and the percentage of revenue that remains is the gross profit margin.
Why does this number matter? It shows how efficiently a business turns sales into profit before paying for things like rent, salaries, and marketing. A higher margin means more breathing room, while a lower one can be a warning sign. So, how is it calculated, and what affects it? Let’s dive in.
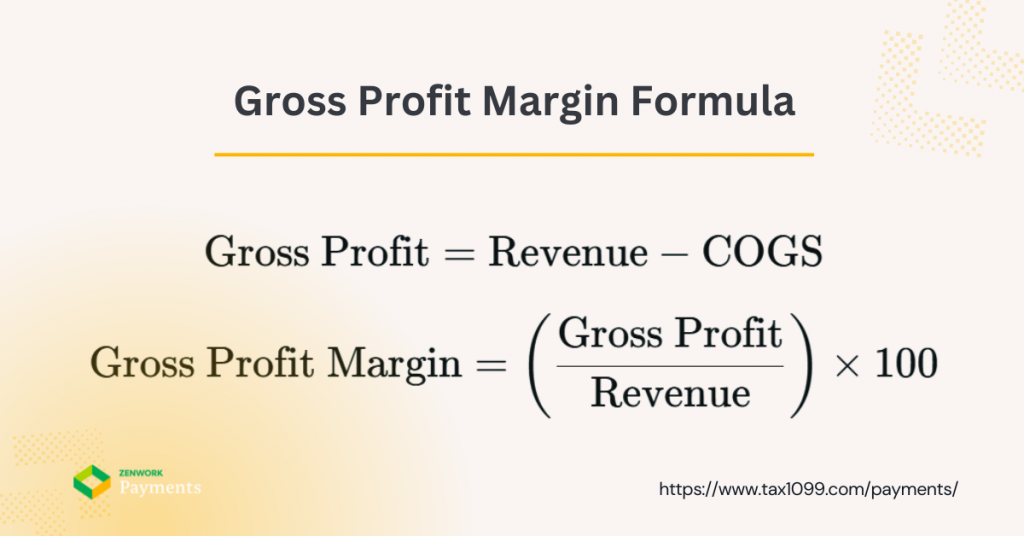
Gross Profit Margin Formula
Let’s discuss the Gross Profit Margin formula with an example.
Gross Profit = Revenue – Cost of Goods Sold
Gross Profit Margin = (Gross Profit) / Revenue × 100
Gross Profit Margin Example
Let’s say you run a coffee shop:
- You sell $10,000 worth of coffee in a month
- The coffee beans, milk, cups, etc. cost you $4,000
- Your gross profit margin would be (10,000 – 4,000) / 10,000 × 100 = 60%
That means 60% of your revenue remains after covering the direct costs of making your products.
According to recent data from NYU Stern School of Business, the average gross profit margin varies widely by industry – from around 17% in auto parts to over 70% in software services.
Operating Profit Margin: What It Is and Why It Matters
Making sales is great, but what really counts is how much a business keeps after covering day-to-day expenses like rent, salaries, and utilities. That’s where operating profit margin comes in. It measures how efficiently a company runs its core operations before interest and taxes come into play.
A strong operating margin means a business isn’t just making money—it’s managing costs well. A shrinking margin, on the other hand, could signal trouble. So, how is it calculated, and what factors can impact it? Let’s break it down in a way that actually makes sense.
Operating Profit Margin Formula
Let’s discuss the Operating Profit Margin formula with an example.
Operating Profit Margin = Operating Income / Revenue × 100
Operating Profit Margin Example
Back to our coffee shop:
- $3,000 in rent, utilities, and wages
- Operating profit margin: ($10,000 – $4,000 – $3,000) / $10,000 × 100 = 30%
This tells you how efficiently you’re running your business operations.
Mike Thompson, a financial analyst at Deloitte, explains: “Operating profit margin strips away the noise and reveals how well a company manages its core business activities. It’s the metric that shows if your business model works.”
Net Profit Margin: What It Is and Why It Matters
At the end of the day, what really matters is how much money a business actually keeps after covering all expenses including cost of goods, operating costs, taxes, and even interest. That’s where net profit margin comes in. It’s the clearest picture of a company’s profitability.
A healthy net profit margin means a business isn’t just making sales, it’s running efficiently and keeping more of what it earns. A shrinking margin? That could mean rising costs, poor pricing, or financial trouble. So, how is it calculated, and what can businesses do to improve it? Let’s break it down.
Net Profit Margin Formula
Let’s discuss the Net Profit Margin formula with an example.
Net Profit Margin = Net Income / Revenue × 100
Net Profit Margin Example
Continuing with our coffee shop:
- $3,000 in operational costs
- $500 in taxes and loan interest
- Net profit margin: ($10,000 – $4,000 – $3,000 – $500) / $10,000 × 100 = 25%
This means you’re keeping 25 cents of every dollar you make.
Net profit margins tend to be much slimmer than gross margins. According to a recent study by Bain & Company, the average net profit margin across all industries is around 7%, with significant variation between sectors.
Why Do Profit Margins Matter?
Profit margins do more than just show how much money a business is making—they reveal how well it’s managing costs, pricing products, and staying competitive. A strong margin means a company can handle challenges, invest in growth, and reward its owners. A weak margin? That’s a sign that expenses might be too high or pricing too low.
For investors, profit margins help decide if a business is worth backing. For business owners, they guide smart financial decisions. So, what impacts profit margins, and how can companies improve them? Let’s take a closer look.
Profit margins matter for so many reasons:
- They show if your business model is sustainable
- Investors use them to decide if your company is worth putting money into
- They help you compare your performance against competitors
- They reveal if your pricing strategy makes sense
- They highlight areas where you might be spending too much
Sarah Johnson, who runs a successful chain of boutique clothing stores, shares: “When I started tracking my profit margins by product line instead of just overall, I discovered that 20% of my inventory was actually losing money. That changed everything about how I managed my business.”
Comparing Profit Margins Across Industries
Not all profit margins are created equal! A “good” margin in one industry might be considered terrible in another. For example, grocery stores run on razor-thin margins, while software companies often see much higher profits. Why the big difference? It all comes down to costs, competition, and business models.
Understanding industry benchmarks helps businesses set realistic goals and investors make smarter decisions. So, which industries have the highest and lowest profit margins? And what factors drive these differences? Let’s break it down.
Industries with High Profit Margins
Some industries naturally enjoy higher profit margins due to factors like low production costs, strong pricing power, and limited competition. Here are a few that consistently rank at the top:
- Software and SaaS companies (20-30% net margin) – Once software is developed, selling additional copies costs almost nothing, leading to extremely high margins. Recurring revenue from subscriptions also helps keep profits steady.
- Pharmaceuticals (15-25% net margin) – Patents protect new drugs from competition, allowing companies to set high prices. Plus, life-saving medications often face little price sensitivity.
- Luxury goods (10-20% net margin) – Designer brands thrive on exclusivity and premium pricing, meaning customers are willing to pay far more than the production cost.
A great example is Shopify, which reported a 79% gross margin in 2022. That doesn’t mean they were overcharging customers—it’s just that digital products have minimal direct costs once built. Unlike a retailer that needs to buy and ship inventory, Shopify’s costs remain low while revenue scales up.
Other industries with strong margins include legal services, financial firms, and high-end consulting, where expertise and reputation allow businesses to charge premium rates with relatively low overhead.
Industries with Low Profit Margins
Some industries operate on razor-thin margins, meaning they make only a small profit on each sale. To stay afloat, they rely on high sales volume, tight cost control, and operational efficiency. Here are a few examples:
- Grocery stores (1-2% net margin) – With intense competition and low-priced essential goods, grocery stores must sell massive volumes to turn a profit. They also battle spoilage, theft, and fluctuating supplier costs.
- Airlines (3-5% net margin, in good years) – Airlines have high fuel, labor, and maintenance costs while dealing with unpredictable demand and price-sensitive travelers. Even a small increase in fuel prices can wipe out profits.
- Construction (3-5% net margin) – With expensive materials, labor costs, and long project timelines, construction companies often struggle to maintain strong margins, especially when faced with delays or unexpected expenses.
A local grocery store owner explains: “We make about 1.5 cents on every dollar of sales. That means we need to be incredibly careful about waste, theft, and inventory management. A 2% improvement in our margin would more than double our profits.”
Fast food chains, retail stores, and logistics companies also face similar challenges, making every fraction of a percent in cost savings critical to staying profitable.
What is a Good Profit Margin?
There’s no one-size-fits-all answer, but many businesses aim for a net profit margin of at least 10%. However, this number can vary widely depending on the industry, business model, and cost structure. For example, a SaaS company might comfortably operate with a 20-30% margin, while a grocery store might consider 2% a success.
So, how do you know if your profit margin is healthy? A good approach is to:
- Research industry averages for your sector – Look at reports, benchmarks, and financial statements from similar businesses to understand what’s typical.
- Compare yourself to similar-sized competitors – A small startup won’t have the same margins as an established corporation, so it’s important to compare apples to apples.
- Track your own margins over time – Watching trends in your profit margins helps spot early warning signs of rising costs or pricing inefficiencies before they become major problems.
At the end of the day, a “good” margin is one that supports growth, stability, and reinvestment while staying competitive in the market.
How to Calculate Profit Margin: Step-by-Step Guide
Understanding your profit margin is key to knowing how well your business is performing. Whether you’re tracking gross, operating, or net profit margin, the process follows a simple formula. Let’s break it down step by step.
Step 1: Gather Your Financial Data
Before you start calculating, you’ll need the following numbers from your financial statements:
- Total Revenue – The total amount earned from sales before deducting any expenses.
- Cost of Goods Sold (COGS) – The direct costs of producing or purchasing the goods you sell.
- Operating Expenses – Costs associated with running your business, like rent, salaries, and utilities.
- Taxes and Interest Expenses – Any money paid for taxes or interest on loans.
Step 2: Calculate Your Gross Profit Margin
Gross profit margin shows how much money remains after covering the cost of goods sold. Here’s the formula:
Gross Profit=Revenue – COGS
Gross Profit Margin=(Gross Profit / Revenue) × 100
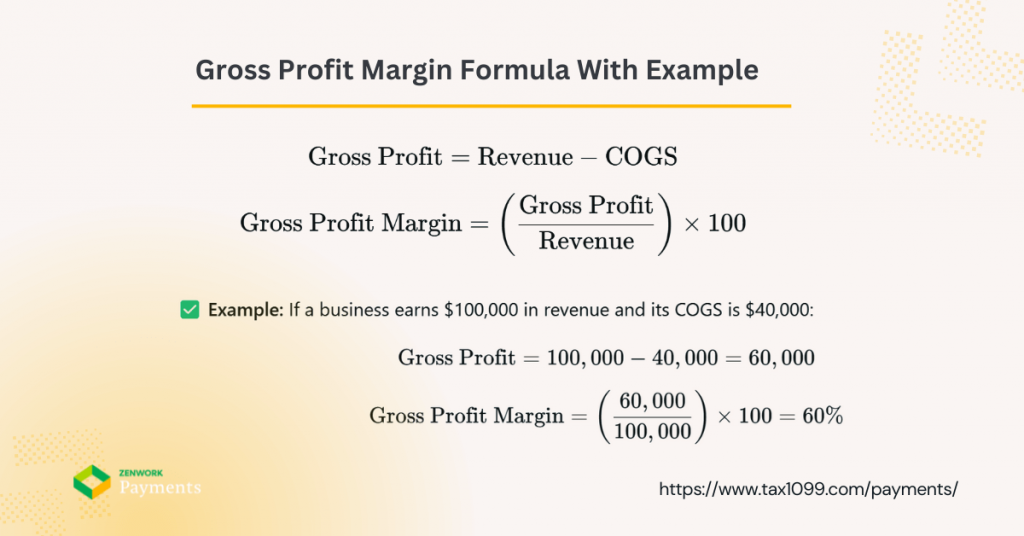
✅ Example: If a business earns $100,000 in revenue and its COGS is $40,000:
Gross Profit = 100,000 – 40,000 = 60,000
Gross Profit Margin = (60,000 / 100,000) × 100 = 60%
This means 60% of revenue remains after covering direct costs.
Step 3: Calculate Your Operating Profit Margin
Operating profit margin accounts for both direct costs and operating expenses.
Operating Profit = Gross Profit − Operating Expenses
Operating Profit Margin = (Operating Profit/Revenue)×100
✅ Example: If the business from our previous example has $30,000 in operating expenses:
Operating Profit => 60,000 − 30,000 = 30,000
Operating Profit Margin => (30,000/100,000) × 100 = 30%
This shows that 30% of revenue is left after covering both direct costs and operating expenses.
Step 4: Calculate Your Net Profit Margin
Net profit margin is the final step—it shows how much profit remains after all expenses, including taxes and interest.
Net Profit => Operating Profit − (Taxes + Interest)
Net Profit Margin => (Net Profit / Revenue) × 100
✅ Example: If the business pays $5,000 in taxes and interest:
Net Profit => 30,000 − 5,000 = 25,000
Net Profit Margin => (25,000/100,000) × 100 = 25%
This means 25% of revenue is actual profit after all expenses.
Why These Calculations Matter
Tracking your profit margins helps you:
✅ Identify areas where costs can be reduced
✅ Compare your performance to industry benchmarks
✅ Make informed decisions on pricing and expenses
✅ Spot trends and catch potential financial issues early
Now that you know how to calculate profit margins, the next step is figuring out ways to improve them! 🚀
Watch out for these common mistakes:
- Forgetting to include all relevant costs
- Using inconsistent time periods for comparison
- Calculating margin when you mean markup (or vice versa)
- Not separating one-time expenses from recurring costs
Factors That Affect Profit Margins
Many factors can impact your margins:
- Cost Management
- Pricing Strategies
- Operational Efficiency
- External Factors
-
Cost Management
Your suppliers, production efficiency, and economies of scale all affect your costs. A 2023 McKinsey study found that companies with sophisticated cost management strategies maintain profit margins 3-5% higher than their peers, even during economic downturns.
Carlos Menendez, a manufacturing consultant, shares: “I worked with a furniture maker who was struggling with margins. We discovered they were ordering materials in small batches, paying premium prices. By shifting to quarterly bulk orders, they improved their gross margin by 7% without changing their selling prices.”
-
Pricing Strategies
Your pricing approach dramatically impacts your margins. Value-based pricing typically leads to higher margins than cost-plus pricing.
A recent pricing experiment by a SaaS company found that changing from feature-based pricing to value-based pricing increased their margins by 15% without significantly affecting conversion rates.
Have you considered whether your pricing truly reflects the value you provide, or are you just marking up based on costs?
-
Operational Efficiency
Streamlining operations can significantly boost your margins.
A restaurant owner in Chicago shares: “We analyzed our kitchen workflow and found we were spending too much time on prep. By reorganizing tasks and investing in a few key pieces of equipment, we reduced labor costs by 22% while serving more customers.”
-
External Factors
Some factors are outside your control but still affect your margins:
During the 2020 pandemic, businesses that could quickly adapt their operational models maintained better profit margins than those that couldn’t.
How to Improve Your Profit Margins
Want better margins? Here are practical strategies:
- Increase Revenue Without Increasing Costs
- Reduce Costs Without Compromising Quality
- Optimize Pricing Strategies
- Invest in Technology & Automation
-
Increase Revenue Without Increasing Costs
- Upsell and cross-sell to existing customers
- Bundle products for higher overall purchase value
- Add complementary services to product sales
- Identify and focus on your highest-margin customers
A hair salon owner implemented a simple product recommendation script for stylists and saw retail sales increase by 34% with no additional marketing costs.
-
Reduce Costs Without Compromising Quality
- Negotiate better terms with suppliers
- Review and reduce waste in your processes
- Consider outsourcing non-core functions
- Implement technology to automate repetitive tasks
“We cut our accounts payable processing costs by 67% by implementing automation software,” says a CFO of a mid-sized manufacturing company. “The system paid for itself in under four months.”
-
Optimize Pricing Strategies
- Test different price points to find optimal margins
- Implement tiered pricing structures
- Create premium options for price-insensitive customers
- Reduce discounting by adding value instead of cutting prices
When was the last time you tested a price increase on your products? Many businesses find they’ve been under pricing for years.
-
Invest in Technology & Automation
Technology can dramatically improve margins through:
- Providing better analytics for decision-making
A recent study by Gartner found that businesses using AI and automation in their financial processes saw an average margin improvement of 5.1% over two years.
Analyzing Profit Margin Trends for Better Business Decisions
Looking at margins over time tells you more than a single snapshot:
- Monthly trend analysis: Helps you spot seasonal patterns
- Year-over-year comparison: Shows long-term progress
- Product/service line breakdown: Reveals which offerings are most profitable
Jorge’s Plumbing Service tracked profit margins by service type and discovered emergency calls had a 45% margin while scheduled maintenance was only at 22%. This led to a marketing shift that increased high-margin emergency service calls by 30%.
Try asking: “Which specific products or services contribute most to my overall margin? Am I focusing enough attention on these areas?”
Common Profit Margin Mistakes and How to Avoid Them
Watch out for these pitfalls:
- Focusing on revenue growth at the expense of margins Many businesses chase sales volume but end up less profitable.
- Cutting costs that affect quality Short-term margin improvements that hurt customer experience often backfire.
- Neglecting to analyze margins by customer segment Some customers cost more to serve than others.
- Overreliance on discounting Temporary revenue boosts often come with permanent margin expectations.
- Not adjusting pricing for inflation or cost increases This causes steady margin erosion over time.
Rachel, who owns a pet supply store, shares: “We were running constant sales to drive traffic, but when we analyzed the data, our discounted products were actually bringing in customers who rarely bought anything at full price. We were training people to only shop our clearance section.”
The Bottom Line
Understanding your profit margins isn’t just about checking a box on financial reports – it’s about knowing if your business model works and where you can make improvements.
Whether you’re running a coffee shop, a software company, or a manufacturing plant, profit margin analysis reveals the truth about your business’s financial health.
Start by calculating your gross, operating, and net profit margins. Compare them to industry benchmarks. Then look for opportunities to improve them through better pricing, cost management, and operational efficiency.
Remember: a small improvement in margin can translate to a huge improvement in profits. Even a 1% increase in margin can mean thousands of dollars in a small business and millions in a larger one.
What’s one step you could take this week to improve your profit margins? Sometimes the smallest changes lead to the biggest results.
Are You Ready To Transform Your Payments And AP Process?
Start Your 30-Day Free Trial with Zenwork Payments AP Automation Software and experience the benefits of automated AP processing.